Estimating Fingertip Forces, Torques, and Object Curvatures from Fingernail Images
How can we measure the fingertip contact forces when grasping a cup without mounting sensors on the object or the hand? Press your fingertip on the table, and see how the blood moves, making your nail and skin colour change. We will use this property to answer the question.
Here we describe a method, developed in collaboration with the Dept. of Physiology at Umeå University and published at Robotica (Chen et al., 2020), using the deformation and colour distribution of the fingernail and its surrounding skin, to estimate the fingertip forces, torques and contact surface curvatures for various objects. This makes us estimate the shape and material of the contact surfaces and the weight of the objects.
Our method circumvents limitations associated with sensorised objects, gloves or fixed contact surface type. In addition, compared with previous single finger estimation in an experimental environment, we extend the approach to multiple finger force estimation, which can be used for applications such as human grasping analysis. That's again important to understand how humans grasp and manipulate, and therefore how to build and use robot hands that can assist us in daily tasks. Or, indeed, what grip stability and manipulation really means.
Methods
Setup
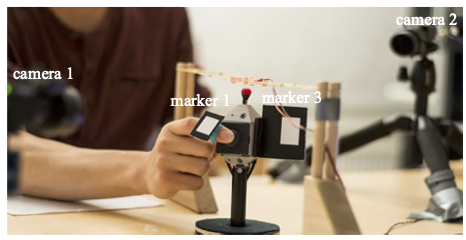
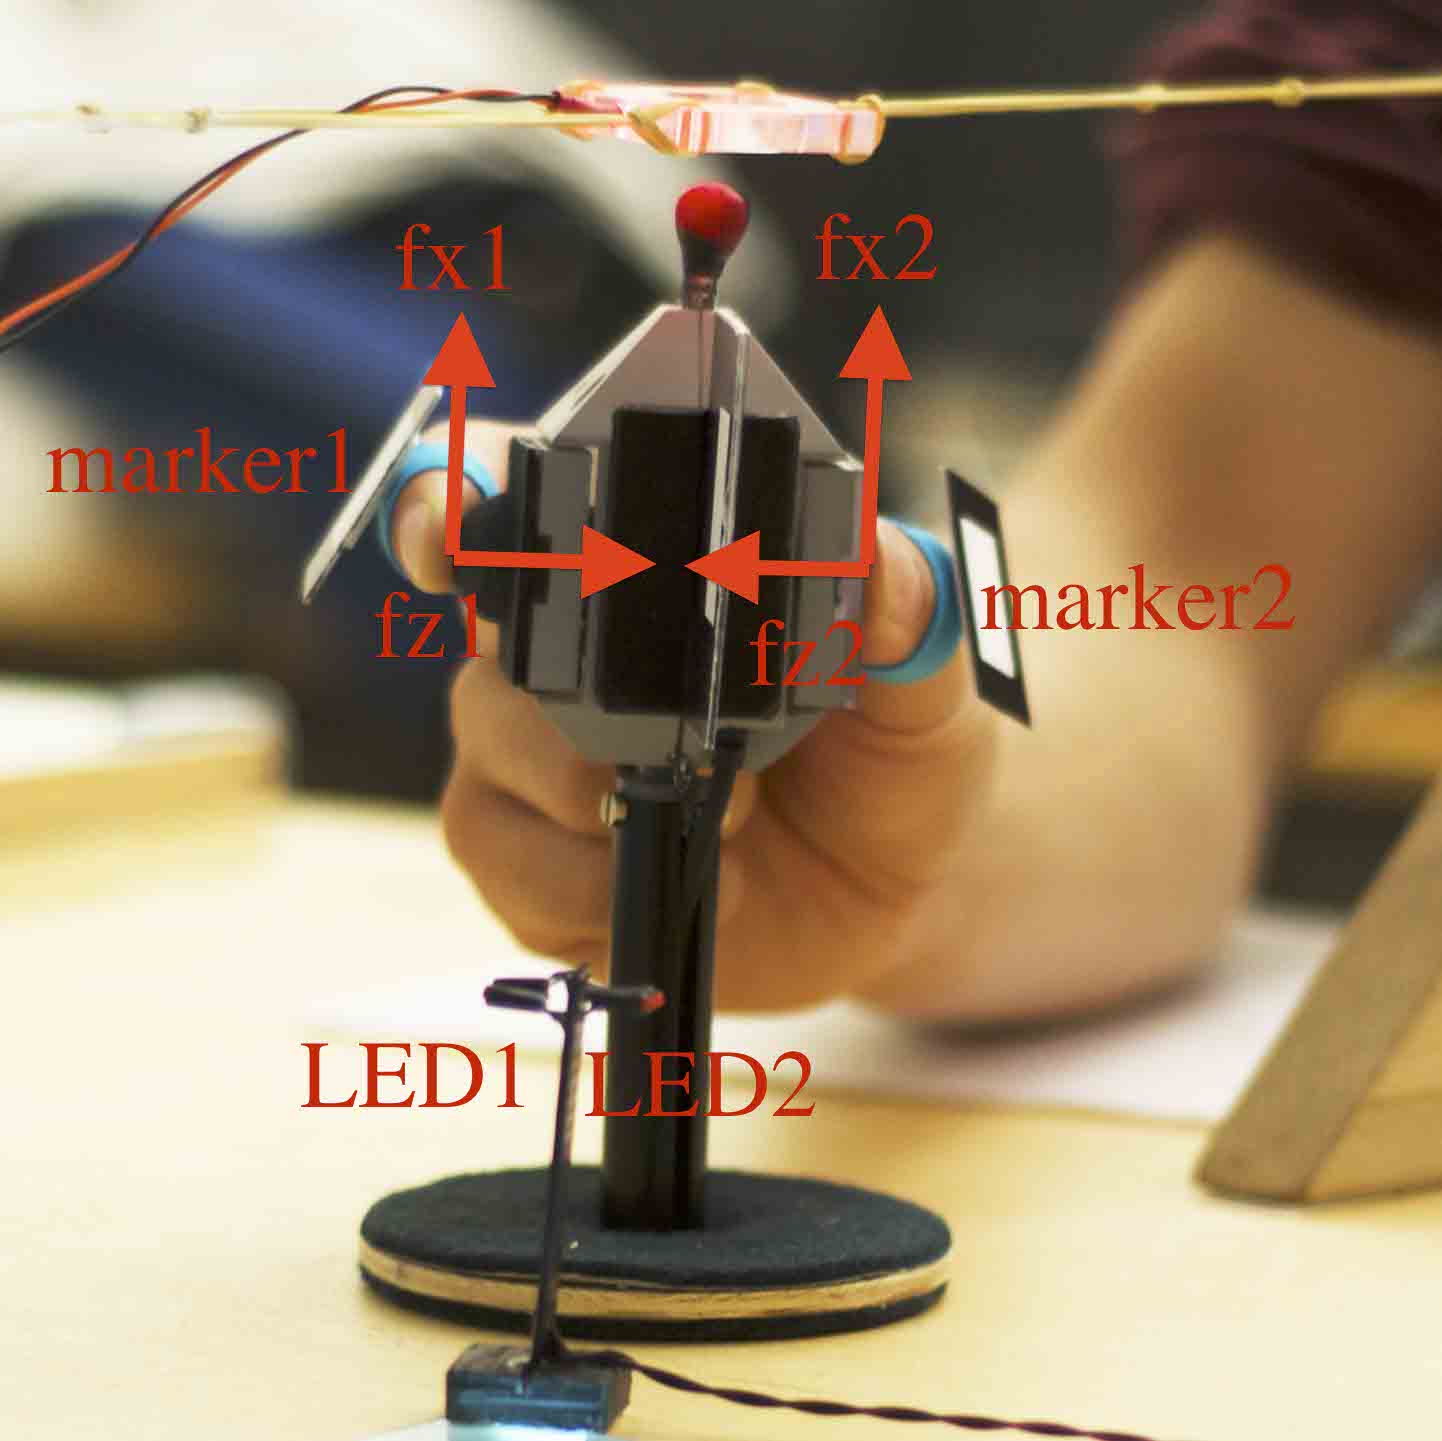
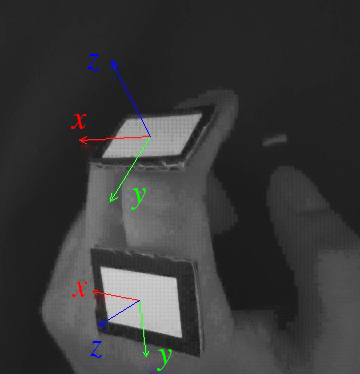
The setup consisted of two stationary cameras and two force/torque sensors. The cameras recorded the distal phalanges of the index finger and thumb, illuminated with diffuse light, as well as markers on the respective nails. Video data was captured by two POINTGREY cameras at 24 fps with a resolution of 1280\(\times\)980 pixels. At the same time, two ATI Nano-17 six-axis force/torque sensors located under the two contact surfaces measured ground truth forces and torques at 100 Hz. The image data and force/torque data were synchronised using two LEDs. The positions and orientations of the markers were detected for the training-data calibration.
|
|
|
| Recording system. Two force torque sensors were mounted on the object for labeling the training data. Camera 1 captured the images of the rectangular marker 1, LED 1 and the index finger, while camera 2 captured the images of marker 2, LED 2 and the thumb. Marker 3 was attached to the side of object. The distance between the two contact surfaces was 49.5 mm. The object allowed easy adjustment of its weight (by a mechanism under the desk) and contact surfaces. | |
|
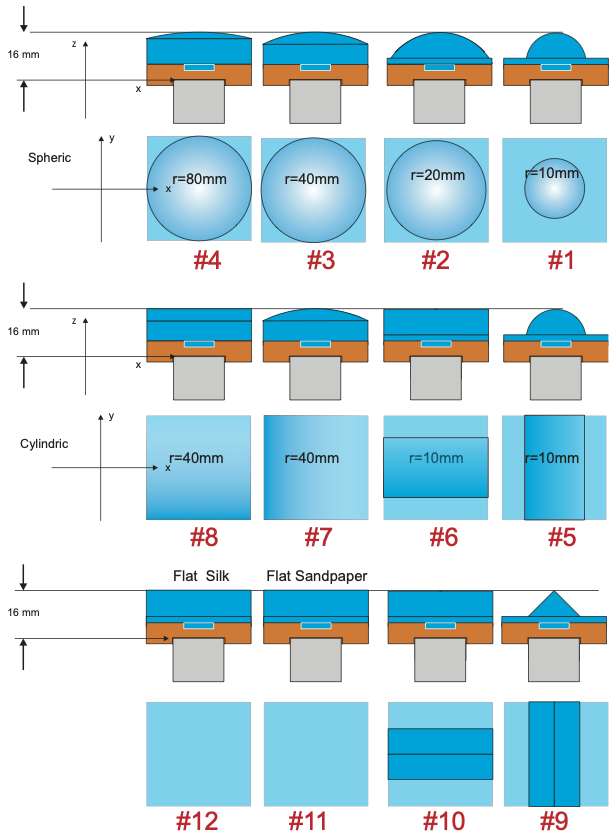
| Contact surfaces for the index finger. Odd rows are the front view, and even rows are the top view. # 1 to # 11 are sandpaper and # 12 is silk. r represents the radius of the surface. # 5 to # 8 are flat in the $x$ or $y$ direction; therefore, $r$ only represents the radius of the non-flat direction. The surface on the sensor of the thumb is flat sandpaper. |
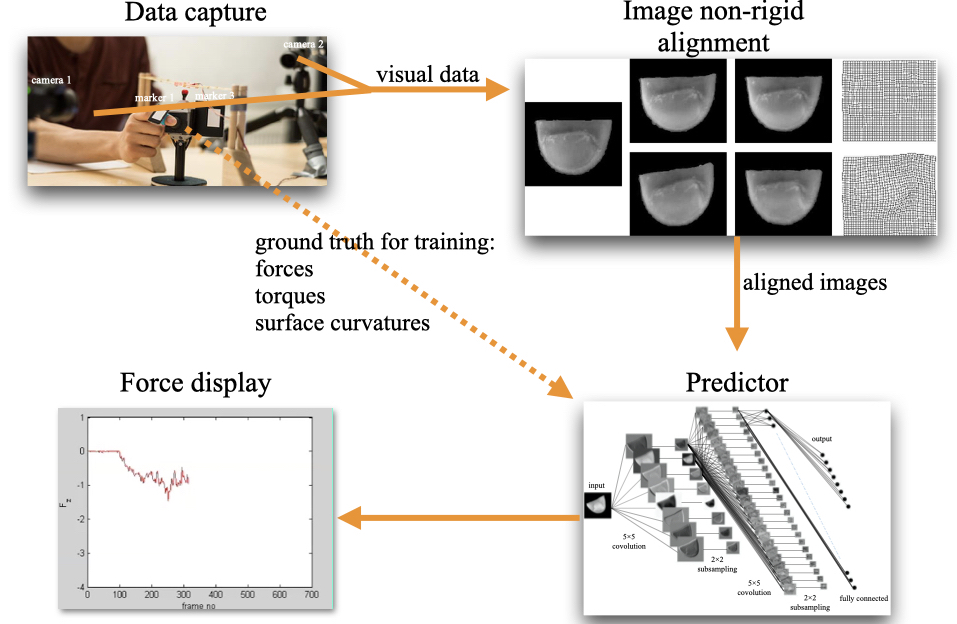
Image alignment
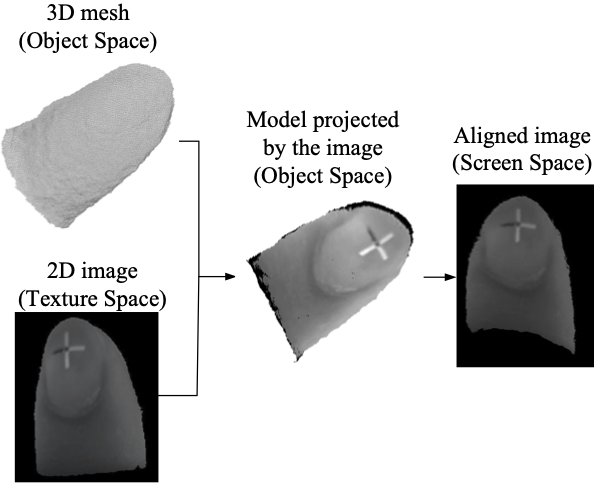
Image alignment was developed to reduce the variance caused by the finger orientation and location in the visual data. The fingernail and its surrounding skin were segmented from the background based on the edge, and the fingernail geometry centers were shifted to the same position in the images.
Applying a nonrigid alignment method, alignment transformations were generated using the blue channel of the image since it (as well as the red channel) varied little with contact forces.
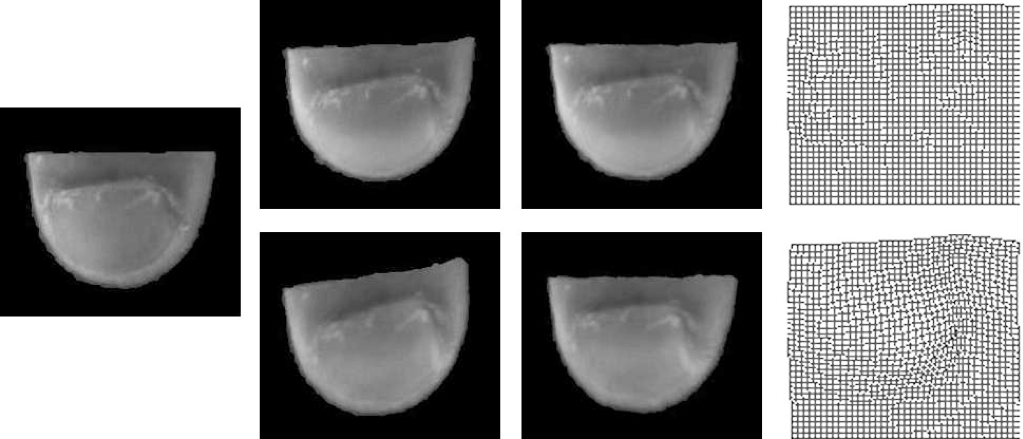
|
| Image alignment with mesh transformation illustration.The columns from left to right are the reference image, the images before alignment, the aligned images and the mesh transformation. The finger images are in the green channel. The more deformation the image (row 2, column 2) has before alignment, the more mesh transformation (row 2, column 4) it is. |
Predictors
The fingernail and surrounding skin colour distribution and deformation reflected the changes of contact force. Several variants of predictors were developed to construct the mappings from the finger images to the fingertip contact force/torque and contact surface curvatures. We investigated four prediction methods: Gaussian Process (GP) regression, Convolutional Neural Networks (CNN), Neural Networks with Fast Dropout (NN-FD) and Recurrent Neural Networks with Fast Dropout (RNN-FD).
In our implementation, the inputs were aligned images. The associated targets were the measured forces and torques and the curvature of the surface in contact with the fingertip.
Calibration
The output of the force/torque sensors consisted of the forces and torques applied on each sensor, but these were not exactly equal to the fingertip forces and torques because of the shift of the contact position and the rotation of the finger with respect to the sensor. Therefore, we calibrated separately the forces and torque to correct the fingertip forces (based on the positions and orientations of the markers) and torques. After training a force/torque predictor by the calibrated training and validation data, calibration of the testing data was only for the purpose of checking the accuracy of the results. When the system is used ``in production'', the calibration process is not required.
Experiments and results
Data
Five healthy, right-handed participants (age 19--65; one female) were asked to repeatedly grasp and lift an instrumented object using their thumb and index finger. We used objects of weight 165, 330 and 660 g. The contact surfaces at the two fingers could easily be changed between any of 12 surfaces, all but one covered with sandpaper: 4 spherical convex surfaces (\(c\)=12.5, 25, 50 or 100 m\(^{-1}\)), 4 cylindrical convex surfaces (\(c_1\) and \(c_2\)=0, 25 or 100), 2 surfaces with triangular surfaces, and 2 flat surfaces (one with sandpaper and one with silk). There were thus 3 weights \(\times\) 12 surfaces = 36 weight–surface combinations. Each participant repeated every combination 5 times in an unpredictable order, i.e., each participant completed a total of 180 grasp-and-lift trials. Each of the two contact surfaces—one for the thumb and one for the index finger—were coupled to a six-axis force/torque sensor (ATI F/T 17). Our experiments required the participants to apply up to as much as \(\approx{15}\,\)N (surface normal force) to pick up the object—our previous studies were restricted to \(\le{10}\,\)N.
The testing samples were selected from time-continuous data, which increases the prediction difficulty compared to when the testing data is randomly selected from the whole data set as in some of the previous work.
We used root-mean-square error (RMSE) to evaluate the results. The unit of force and torque are N and Nmm, respectively, unless otherwise stated.
Force/torque prediction
One of five series of each weight–surface combination was included in the test data set, i.e., 20% of the data was used for testing and 80% for training (and validation, if applicable). The architectures of the predictors were obtained by hyper-paramter search during training.
|
|
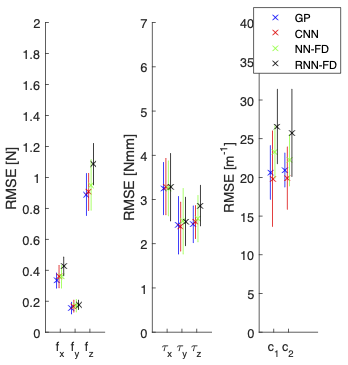
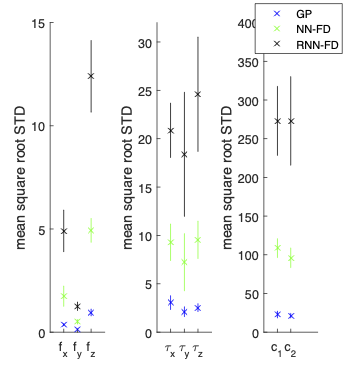
| Predictor comparison for index fingers of all five participants. One of five series was selected as testing data set for each kind of surface and object weight. Each subject has one predictor model. The left and right panels show the output error and the output standard deviation, respectively. (Since there is no standard deviation of the CNN output, it is not included in the right panel.) | |
The accuracy of GPs was slightly higher than that of CNNs, while the latter was considerably faster. Because GPs and CNNs were more accurate than NN-FD and RNN-FD, we focused our analyses on the former.
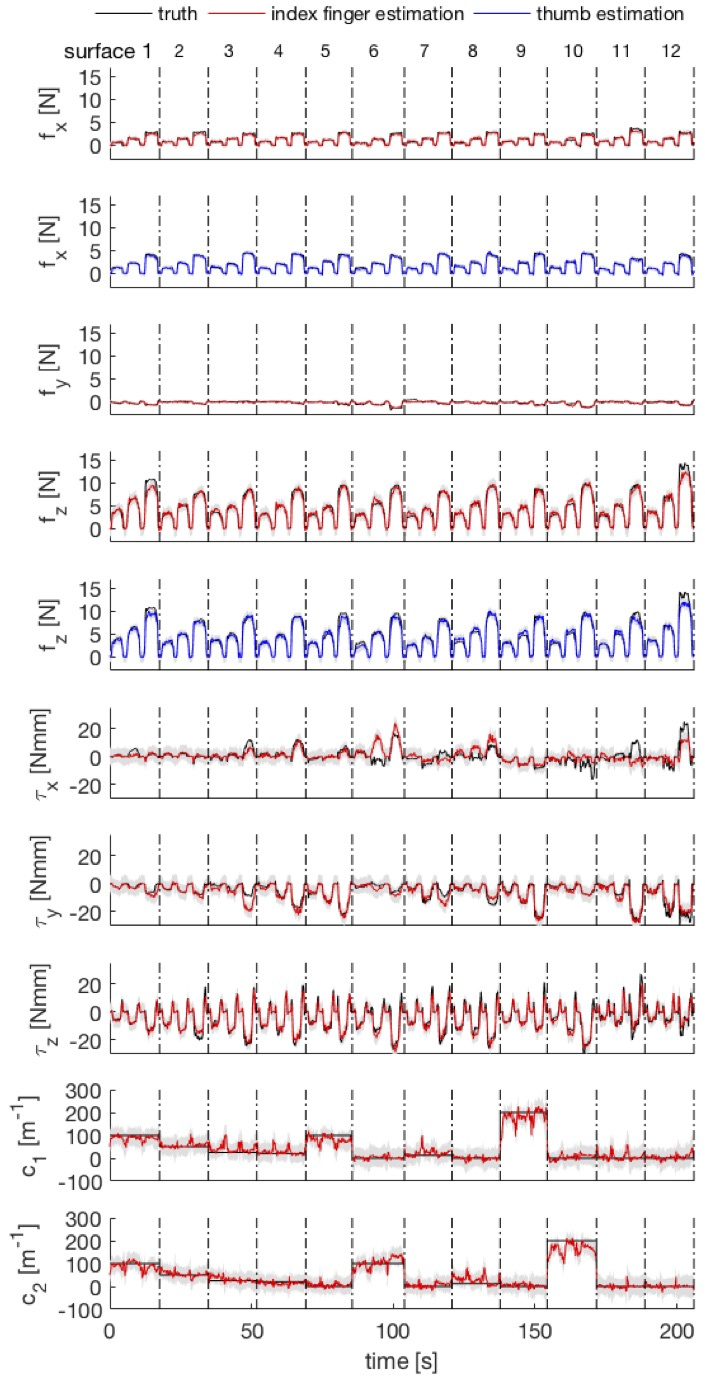
Multiple-finger prediction is crucial for manipulation applications. The following figure shows an example of the prediction of participant \(P_1\). The model was able to predict normal forces of higher than 10 N, although when it was close to 15 N it was not as accurate as at lower forces. The predicted surface normal forces, \(f_z\), of the thumb and index finger were approximately equal to each other (if not, it would imply that the object was accelerated sideways). Moreover, when the object was held stationary in air, the sum of the vertical forces applied by the thumb and index finger counteracted the weight of the object. This also fitted well with model predictions: the \(x\) axes of the fingers were almost vertical and the the sum of the estimated \(f_x\) of the thumb and index finger was indeed approximately equal to the force required to hold the object stationary in air.
|
| Prediction for participant P1 using GPs. In each surface type the grasping is ordered by three types of weights. For observation, the time between two grasping is set to 0, and the grasping of different surfaces is separated by dashed lines instead. The grey areas are the 95% confidence interval. There are 36 trials. |
Cross validation
Our approach was capable of predicting the force and torque by surface cross validation (unseen surface prediction) and a single predictor model across all participants. However, cross prediction over time (training and testing was spaced 1 week) was not precise (the CNN performed more accurately than the GP), since variables such as finger temperature and lighting varied, of course, over time. To handle the cross time validation, further research, such as transfer learning, is required. The numerical results can be found in the paper.
GPs were more accurate than other models in simple conditions, e.g., training each participant separately with small data sets. CNNs, on the other hand, gave more robust results and, of course, were faster when dealing with large data with more variables.
Human grasping analysis
The proposed approach can be used in settings such as robot teleoperation, force-based control and so on. As an example of the applications, we analysed human grasping following a 2009 paper by Johansson and Flanagan with our predictor.
|
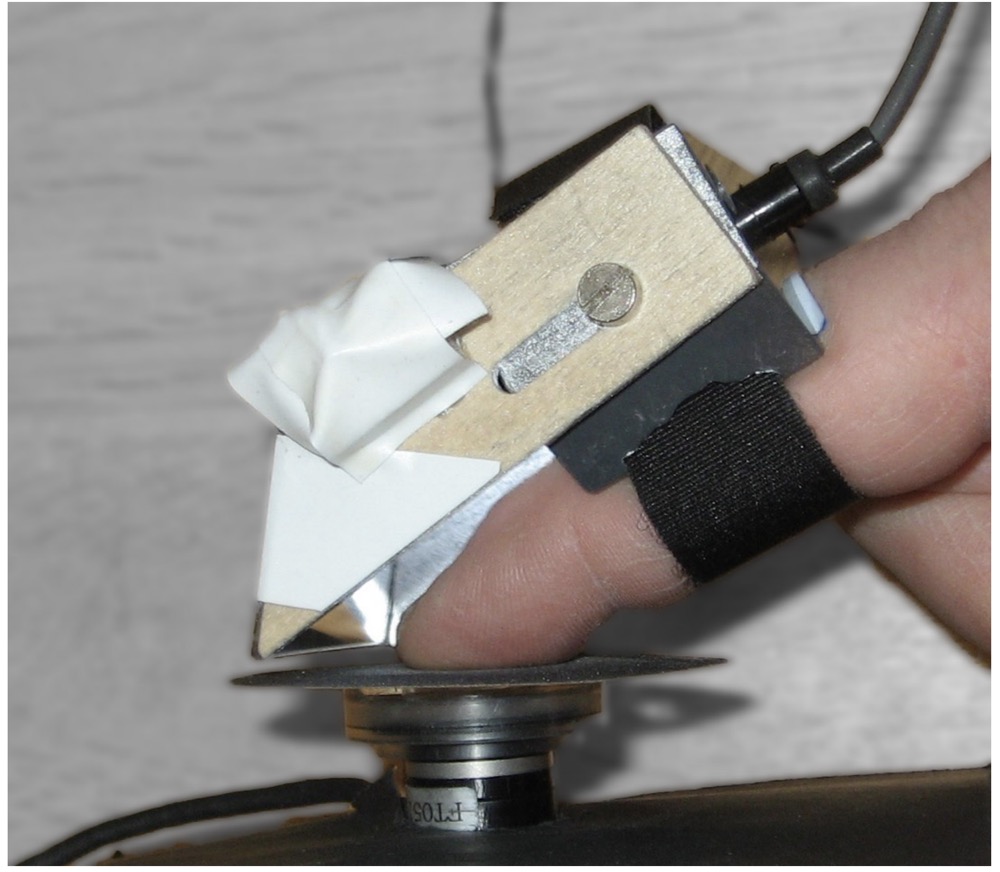
| Grasping the object with flat sandpaper surface. |
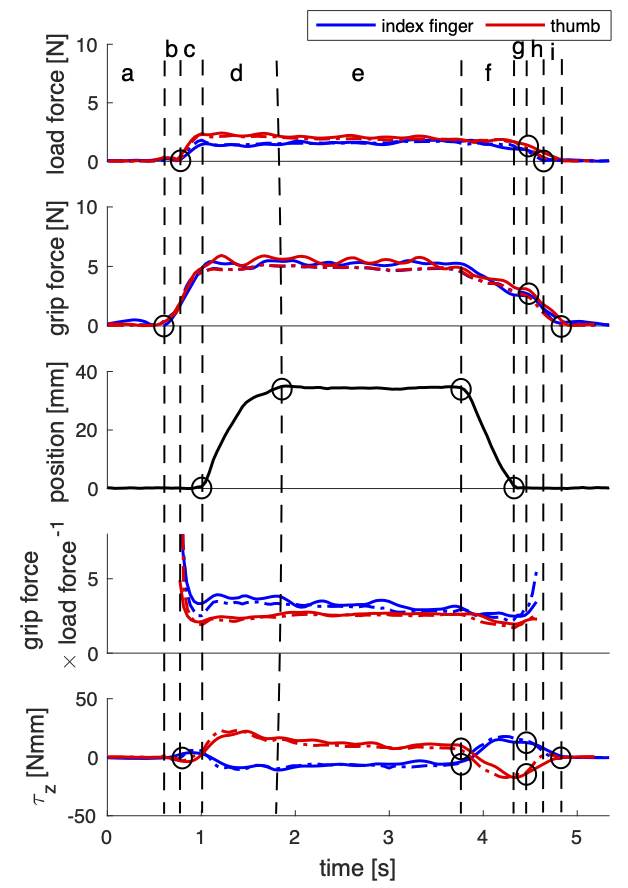
Grasping analysis of \(P_1\) with 330 g weight. The dashed lines are the ground truth and the solid lines are the prediction. The load force is the force length magnitude of \(f_x\) and \(f_y\) and the grip force is \(f_z\). The phases of the trials include: a - reaching phase; b - preload phase; c - loading phase; d - transitional phase; e - static phase; f - replacement phase; g - delay; h - pre-unload phase; i - unloading phase. The h and i phases are possible integrated into one phase, which depends on the placing behaviour of the participants. With the decreasing of the friction, the ratio (grip force \(\times\) load force\(^{-1}\)) increases to avoid slipping. Subfigures in the third row are the position of the object.
Consider the index finger as an example: the loading starts from the critical near zero force. Lifting occurred from \(f_x\) peak to torque peak. While the object was held stationary both forces and torques stable. Replacing occurred from torque peak until \(f_x\) peak and unloading from the lowest point of torque to zero forces.
Further reading
Several other groups also have related studies, which we can find in the introduction of (Chen et al., 2020). The following articles (not included in this blog post) are our early work in this field.
|
| GPs were applied on gripping force detection from fingernail images (IROS 2013). |
|
| The fingernail images were aligned using CNNs (ICRA 2014). |
|
| We studied the force detection influenced by the finger joints using GPs with a combined kernel (IROS 2015). |
Bibliography
Nutan Chen, Göran Westling, Benoni B Edin, and Patrick van der Smagt. Estimating fingertip forces, torques, and local curvatures from fingernail images. Robotica, 38(7):1242–1262, 2020. URL: https://arxiv.org/abs/1909.05659, doi:10.1017/S0263574719001383. ↩ 1 2